

Exec Summary
I was curious about how correlated scores on Rotten Tomatoes were to ticket sales of movies.
I scraped data on domestic box office grosses from BoxOfficeMojo and audience and critic scores from Rotten Tomatoes.
After data cleaning, I looked at ~150 movies and their box office sales in 2023.
Critics scores have a weak correlation to box office grosses. Audience scores have a weak-to-moderate relationship. However, both have a meaningfully better relationship to log grosses.
This analysis can’t account for revenue from streaming or marketing spend and other factors.
With more time, I’d pull more data and work more with the log transformation and its implications.
Regressing Against Log Total Grosses:

Method
I’ll briefly discuss the technical details of scraping the data. Then I’ll talk about cleaning that was necessary. If this doesn’t interest you, you can skip to the summary of the method section!
Data Collection
I needed two things — box office sales data, and rotten tomatoes data. The box office data came from boxofficemojo.com.
This was pretty easy to scrape. Since the HTML was simple, pandas’ pd.read_html() was able to grab the data as is.
The next thing needed was review data from Rotten Tomatoes, and that was meaningfully harder. I spent some time trying to scrape that myself, which was tough. What makes it difficult is that “shadow root” element:
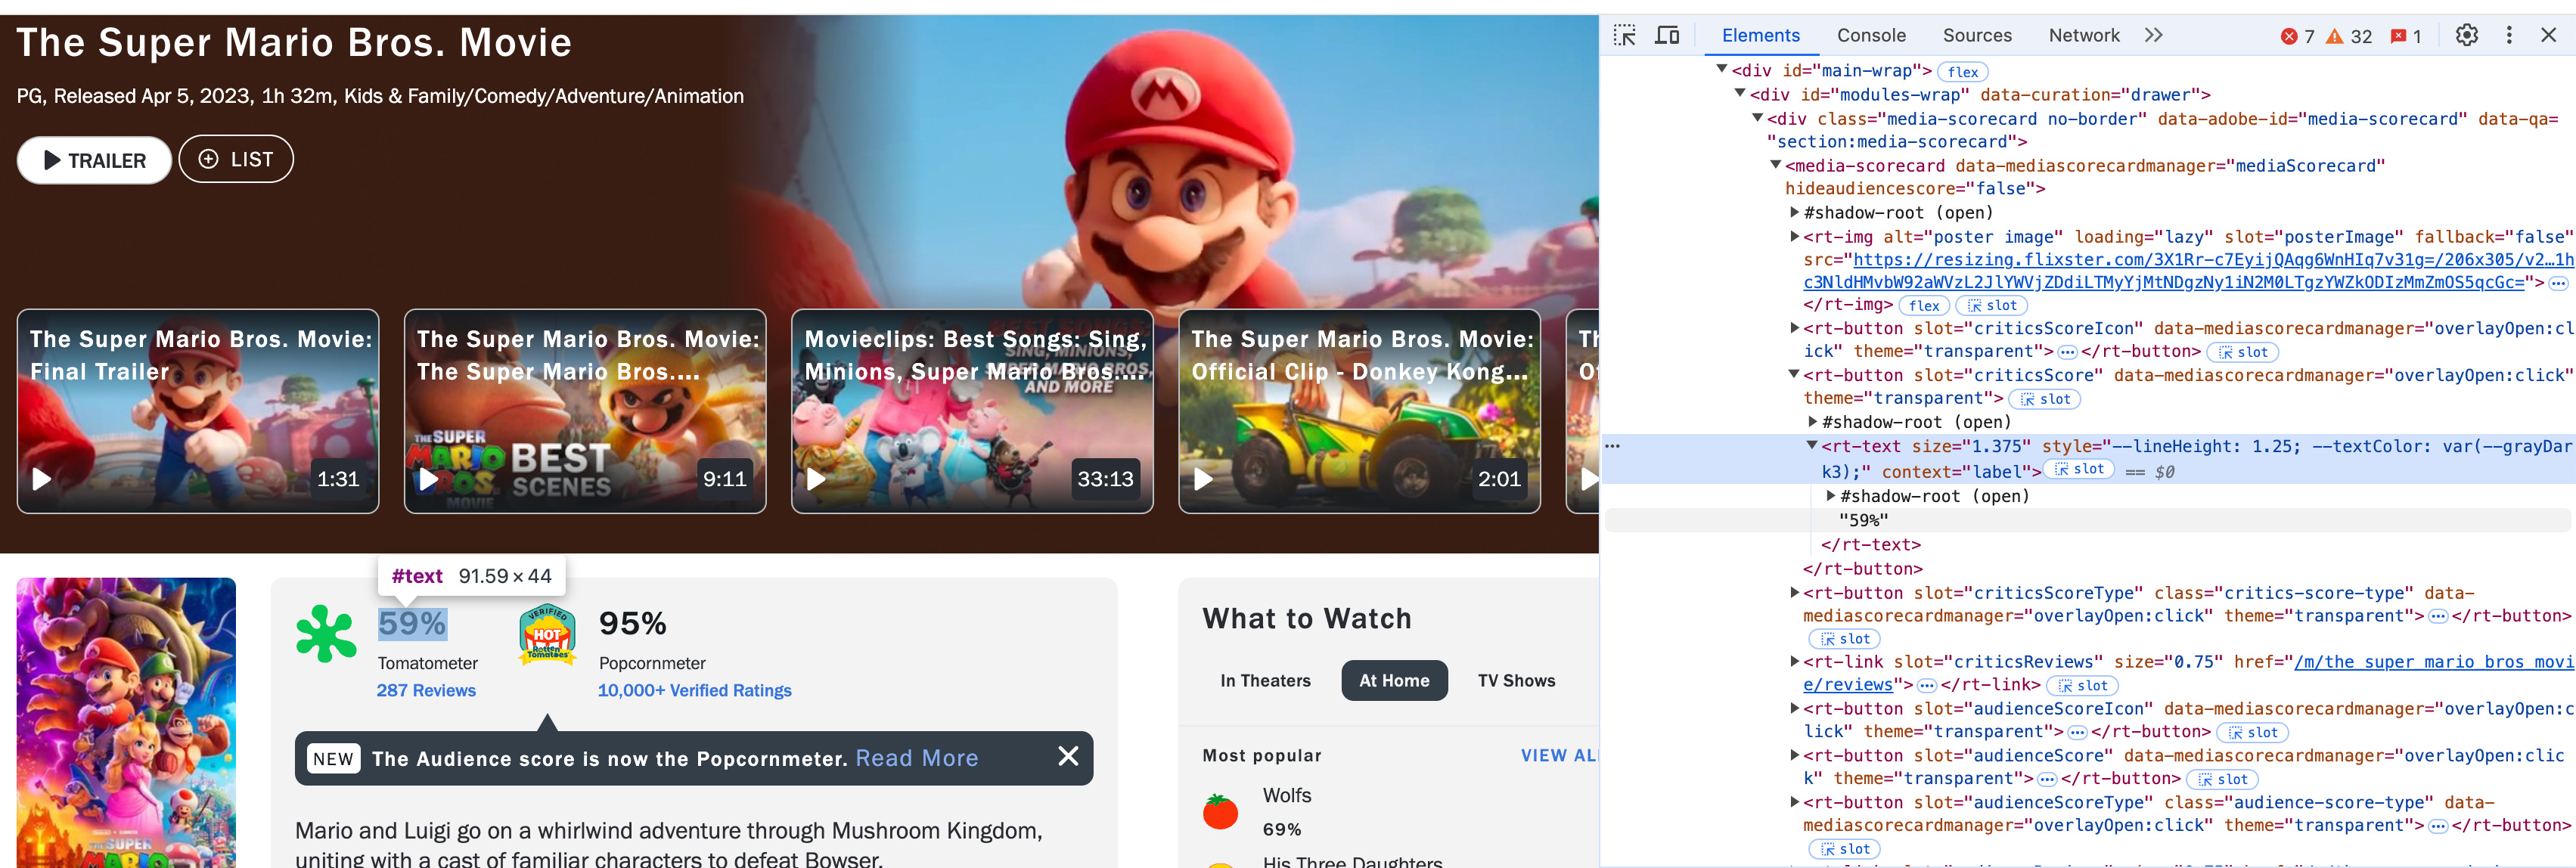
a little bit of googling and back and forth with ChatGPT reveals this is something sites do to stop people from scraping data. Instead of simply using requests for the raw HTML, I tried using selenium to spin up a browser that would load the page, wait a few seconds, and then access the element. It worked okay, but for a lot of pages it would throw errors.
A little more googling and I discovered the handy rottentomatoes-python package. While it also hit the same errors due to the shadow root element, it performed better than my cobbled together script, and was far cleaner to work with, so I ended up using that.
About the Data, Cleaning, and Issues
I started with a list of the top 200 grossing movies in 2023 (which means some could have been released in 2022). I took each movie on that list and searched for it on Rotten Tomatoes. That returned 162 movies, as the rotten tomatoes package couldn’t return data on 38 of them.
From there, I dropped anniversaries and re-releases (e.g. Star Wars: Episode VI - Return of the Jedi 2023 Re-Release — presumably for the 50-year anniversary of Episode VI some theaters ran screenings).
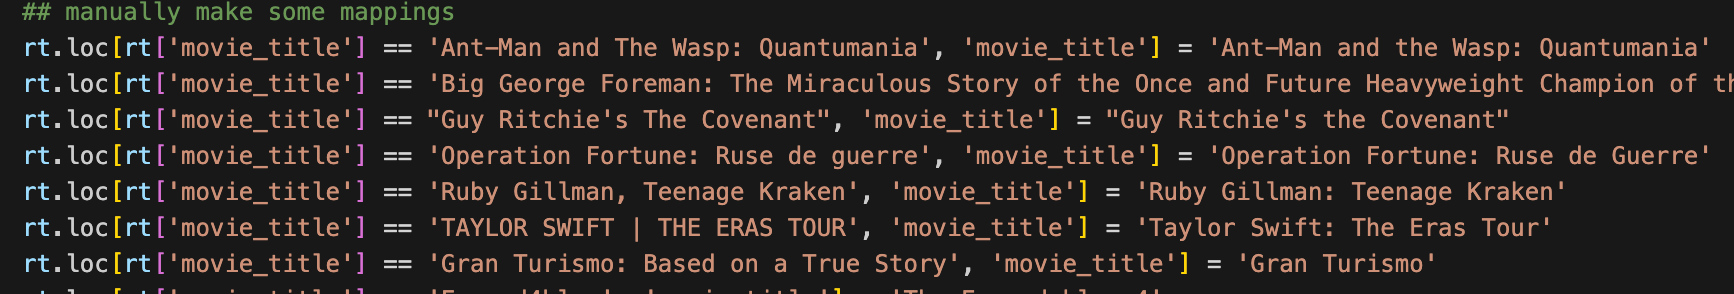
Then I had to join the two datasets together. This is actually non-trivial, because many of the same movies have inconsistent names between Rotten Tomatoes and Box Office Mojo. For example, the biopic about George Foreman is listed in Rotten Tomatoes as Big George Foreman: The Miraculous Story of the Once and Future Heavyweight Champion of the World, whereas Box Office Mojo simply calls the movie Big George Foreman. I tried using the package RapidFuzz to do some fuzzy matching across movie names, but it made my code and the dataframe more complicated, and the result honestly wasn’t much better than just taking the two lists and asking ChatGPT to try to find matching movies. So in the end I just took the best results from both of them and did some manual re-mappings like so:
After all this we’re left with 152 movies on which to do analysis.
Data Summary
I scraped the top 200 grossing movies in 2023 domestically from Box Office Mojo and was able to pull review scores on 162 of those movies from Rotten Tomatoes.
I did some data cleaning:
Theaters will do anniversary screenings and re-releases of movies like Star Wars. I removed these.
Movies were sometimes inconsistently named between the two datasets (e.g. Big George Foreman: The Miraculous Story of the Once and Future Heavyweight Champion of the World vs. Big George Foreman). I first tried fuzzy matching but ultimately just used GPT to surface movies that were similar and manually mapped them.
This left me with 152 movies on which to do analysis.
Just under half of the movies in the sample grossed less than $20 million. So I think we’re capturing something reasonably representative and not just big blockbusters.
Results
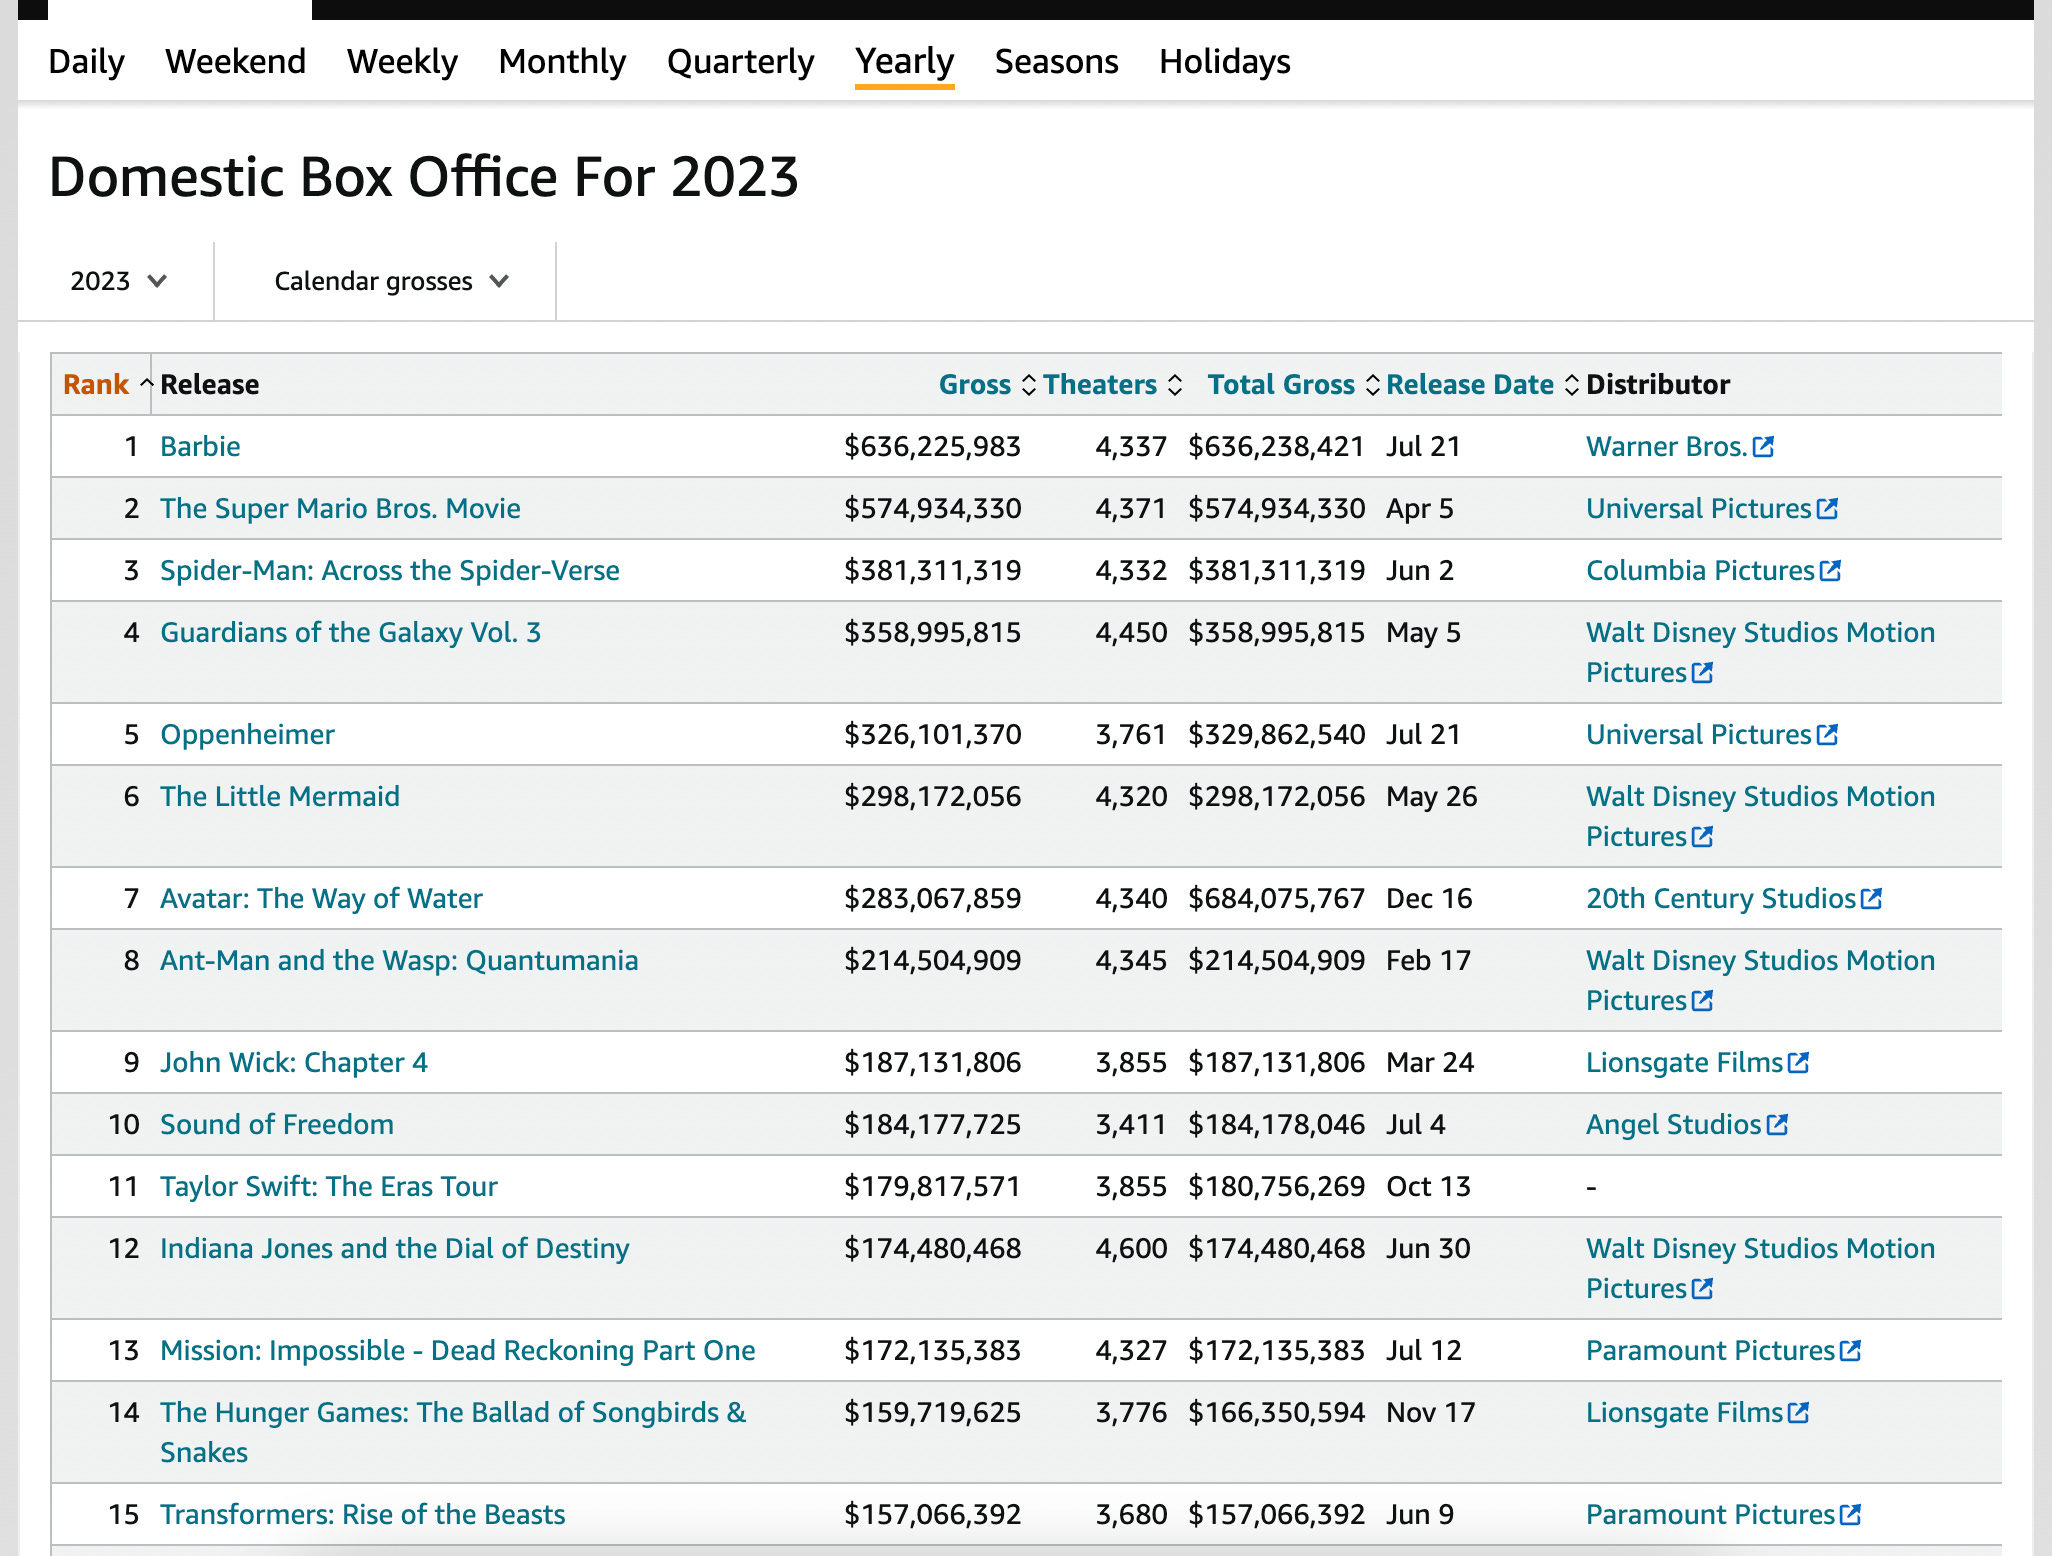
I’ll use total grosses, which is how much the movie made overall vs. just in the calendar year 2023. For example, Avatar: The Way of Water was released in December 2022, but continued to make money in 2023.
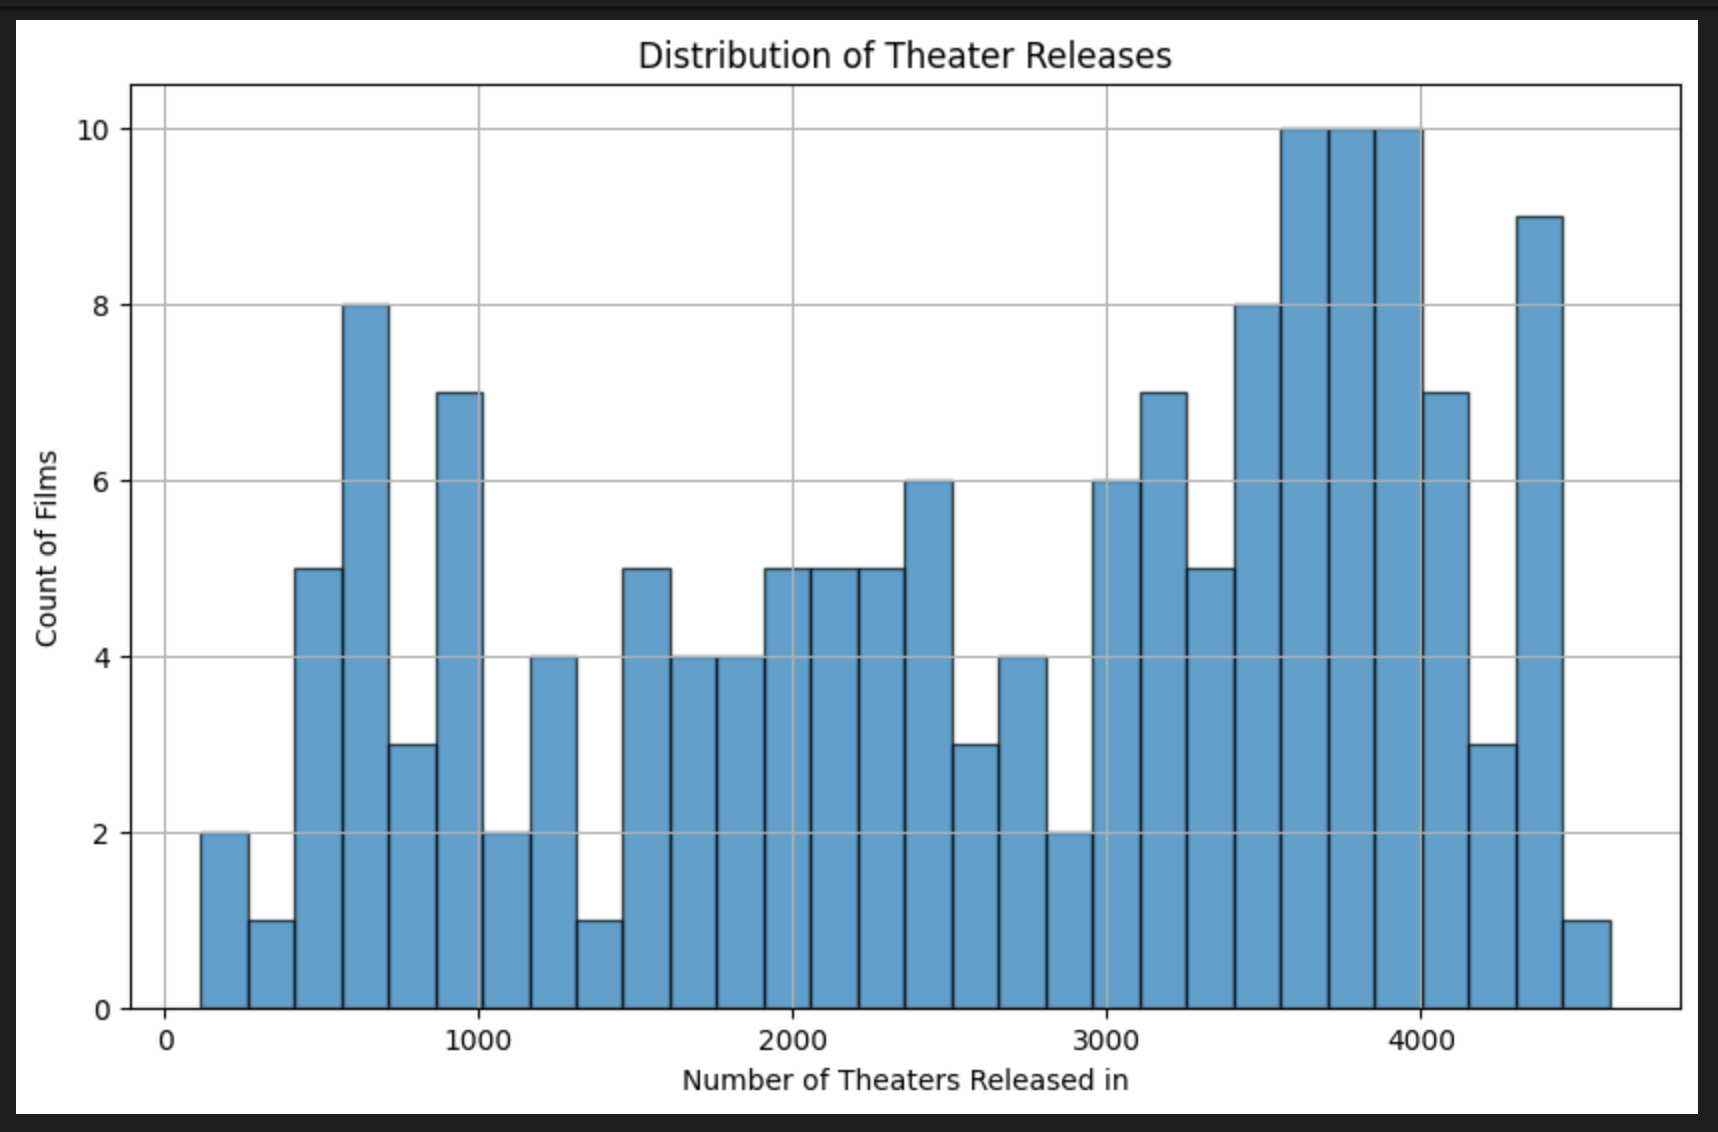
Additionally, we need to account for the fact that some movies are released in more theaters than others — the ones with wider distribution should gross more, so we’ll also consider total gross per theater. As a reference, big-budget movies like Barbie and Oppenheimer have a distribution of 4,000+ theaters, while others have more modest distributions of <2,000 theaters. Here’s a quick chart to get a sense of how this varies:
Finally, Rotten Tomatoes provides both an audience score and a critics score (referred to as the tomatometer. We’ll consider both
With those things in mind let’s look at some results!
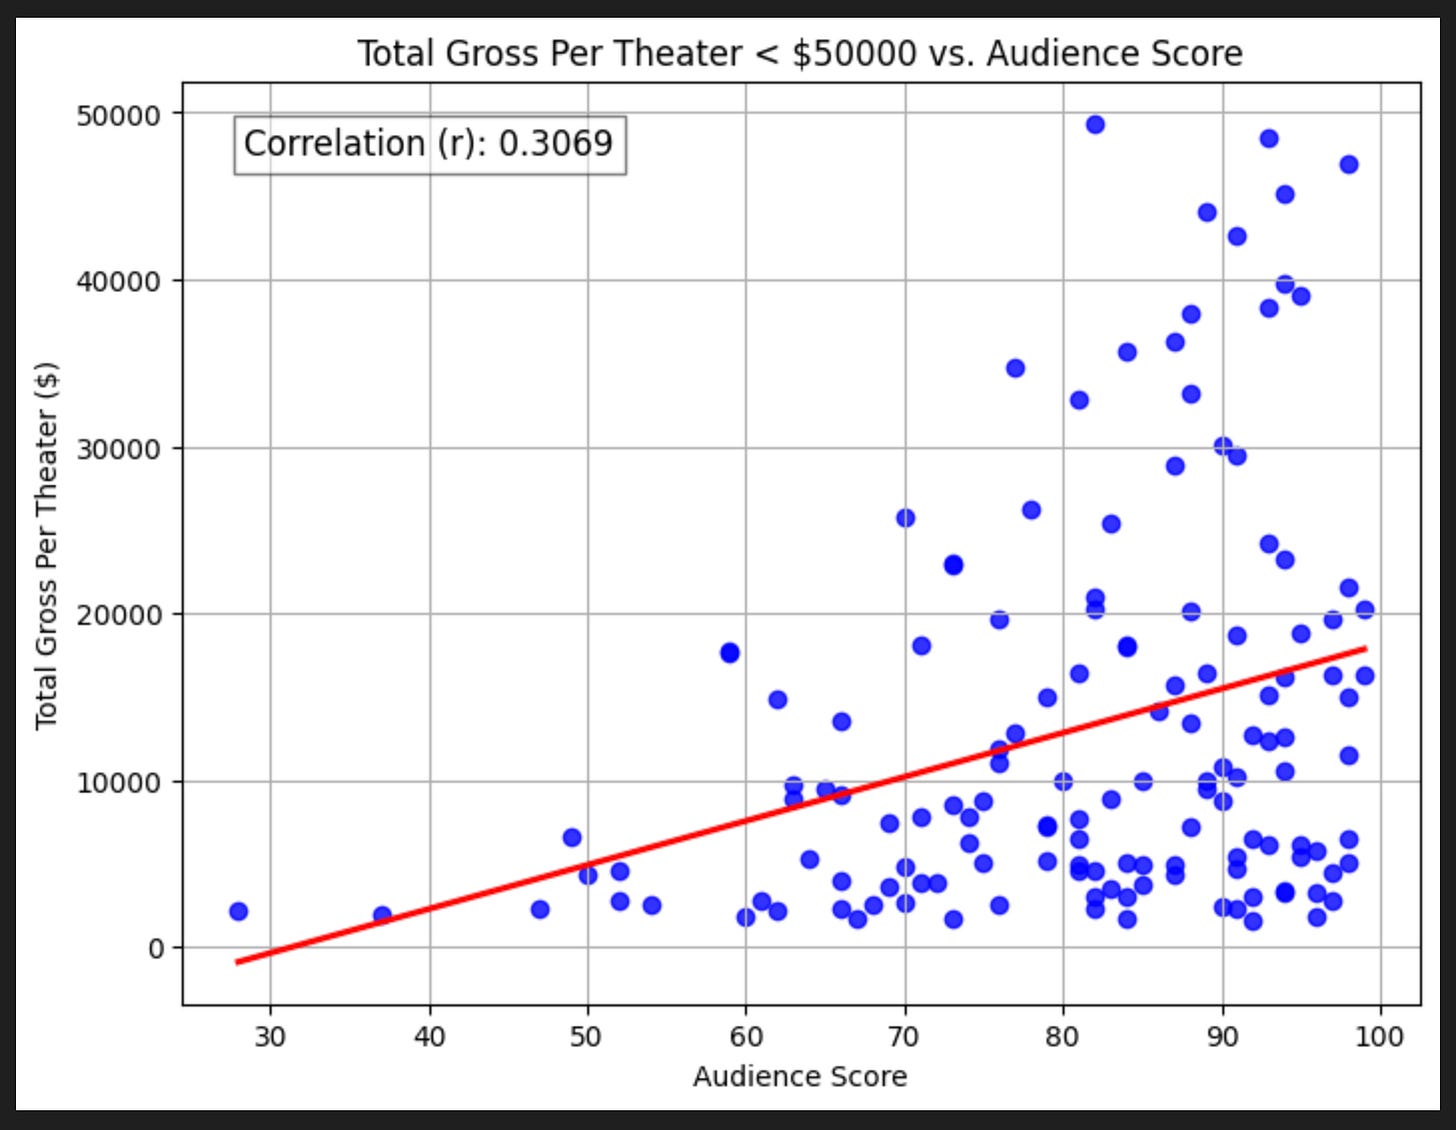
Audience Score
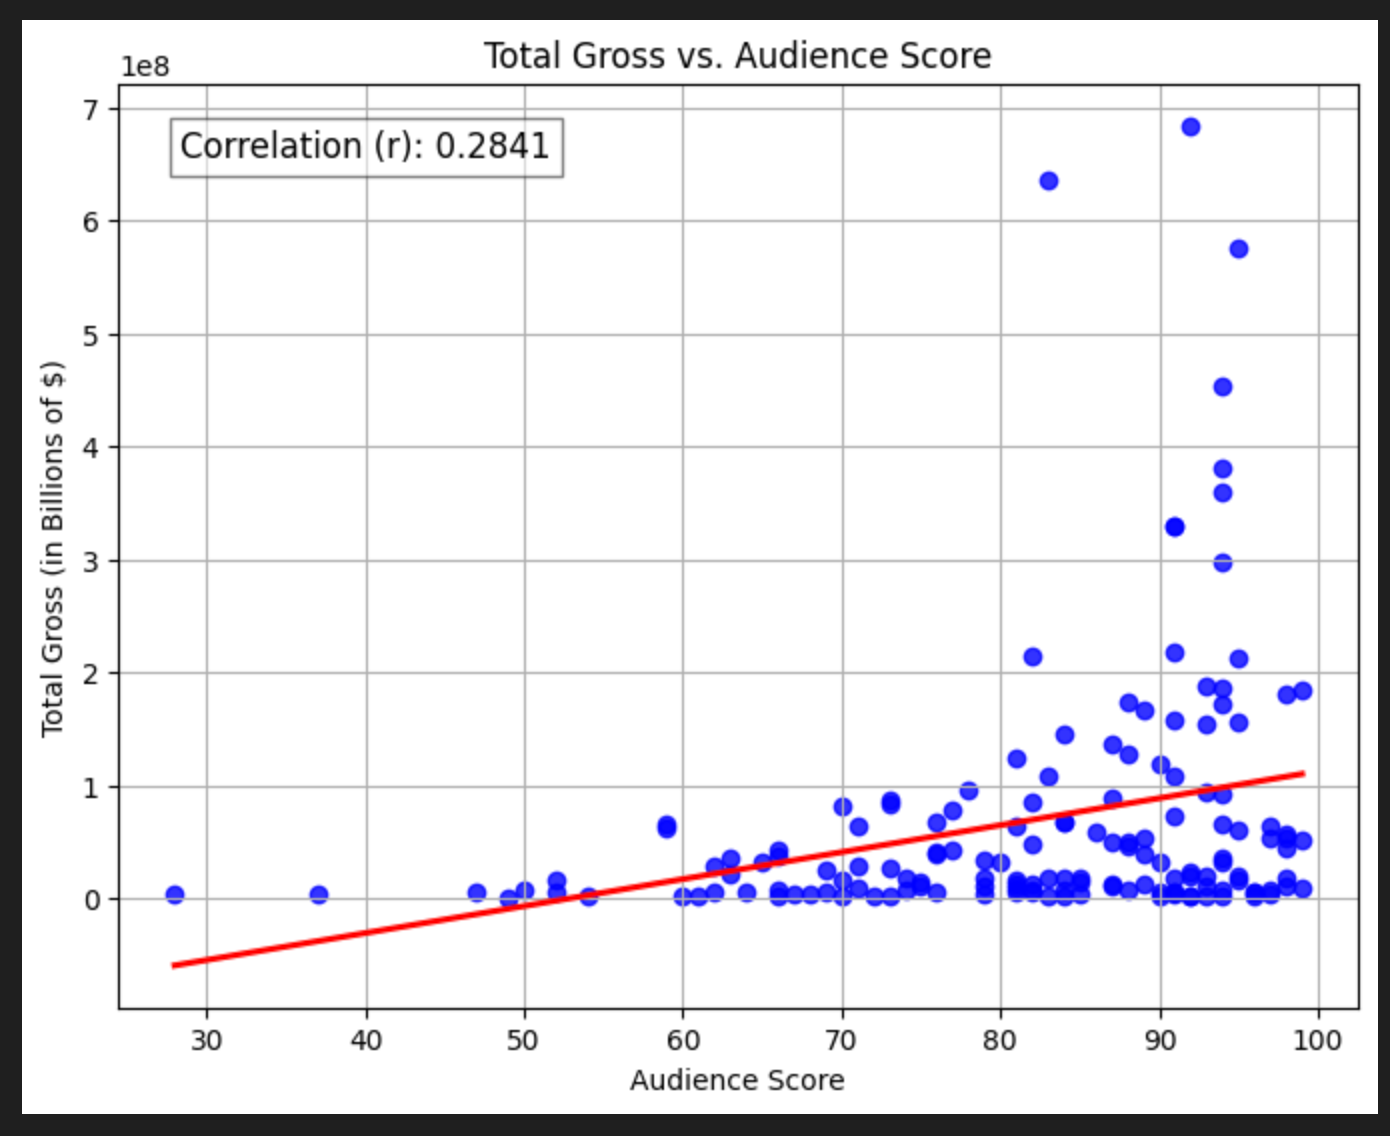
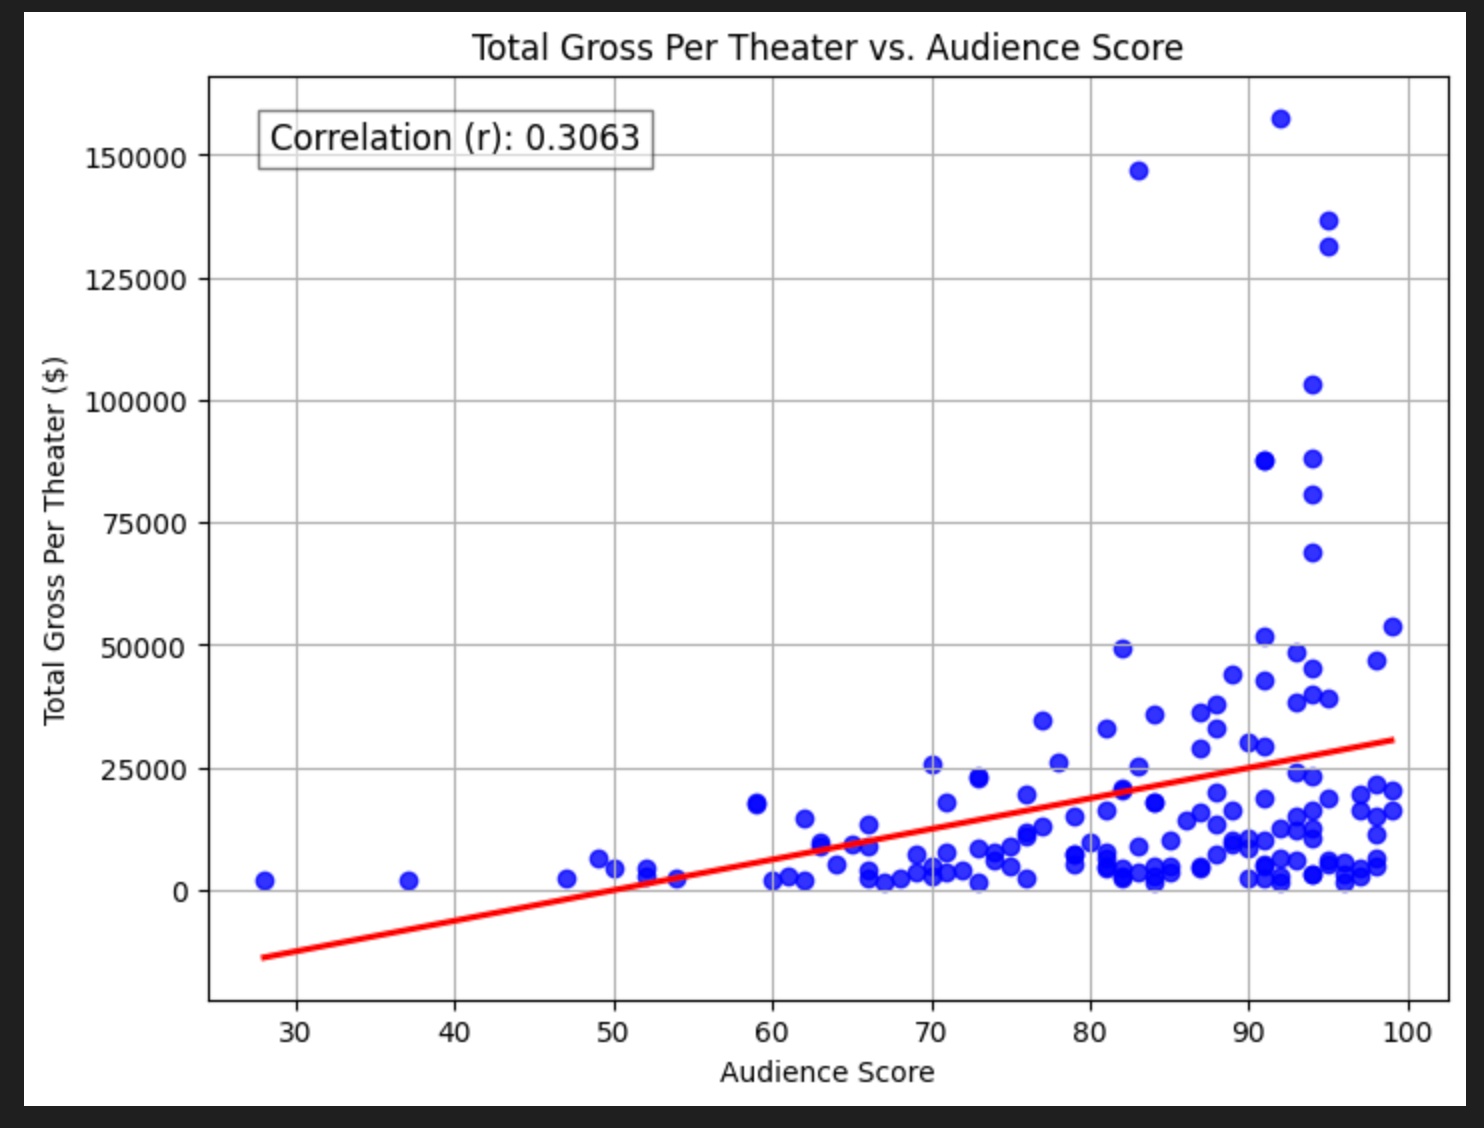
We quickly see there’s some massive outliers (these are things like Barbie and Avatar). Let’s zoom in to movies that make less than $50,000 per theater, which corresponds to movies under $2 billion in grosses.

Interestingly, the correlations don’t really change! No matter what we regress against, it seems the Audience Score has about 0.3 correlation to box office grosses.
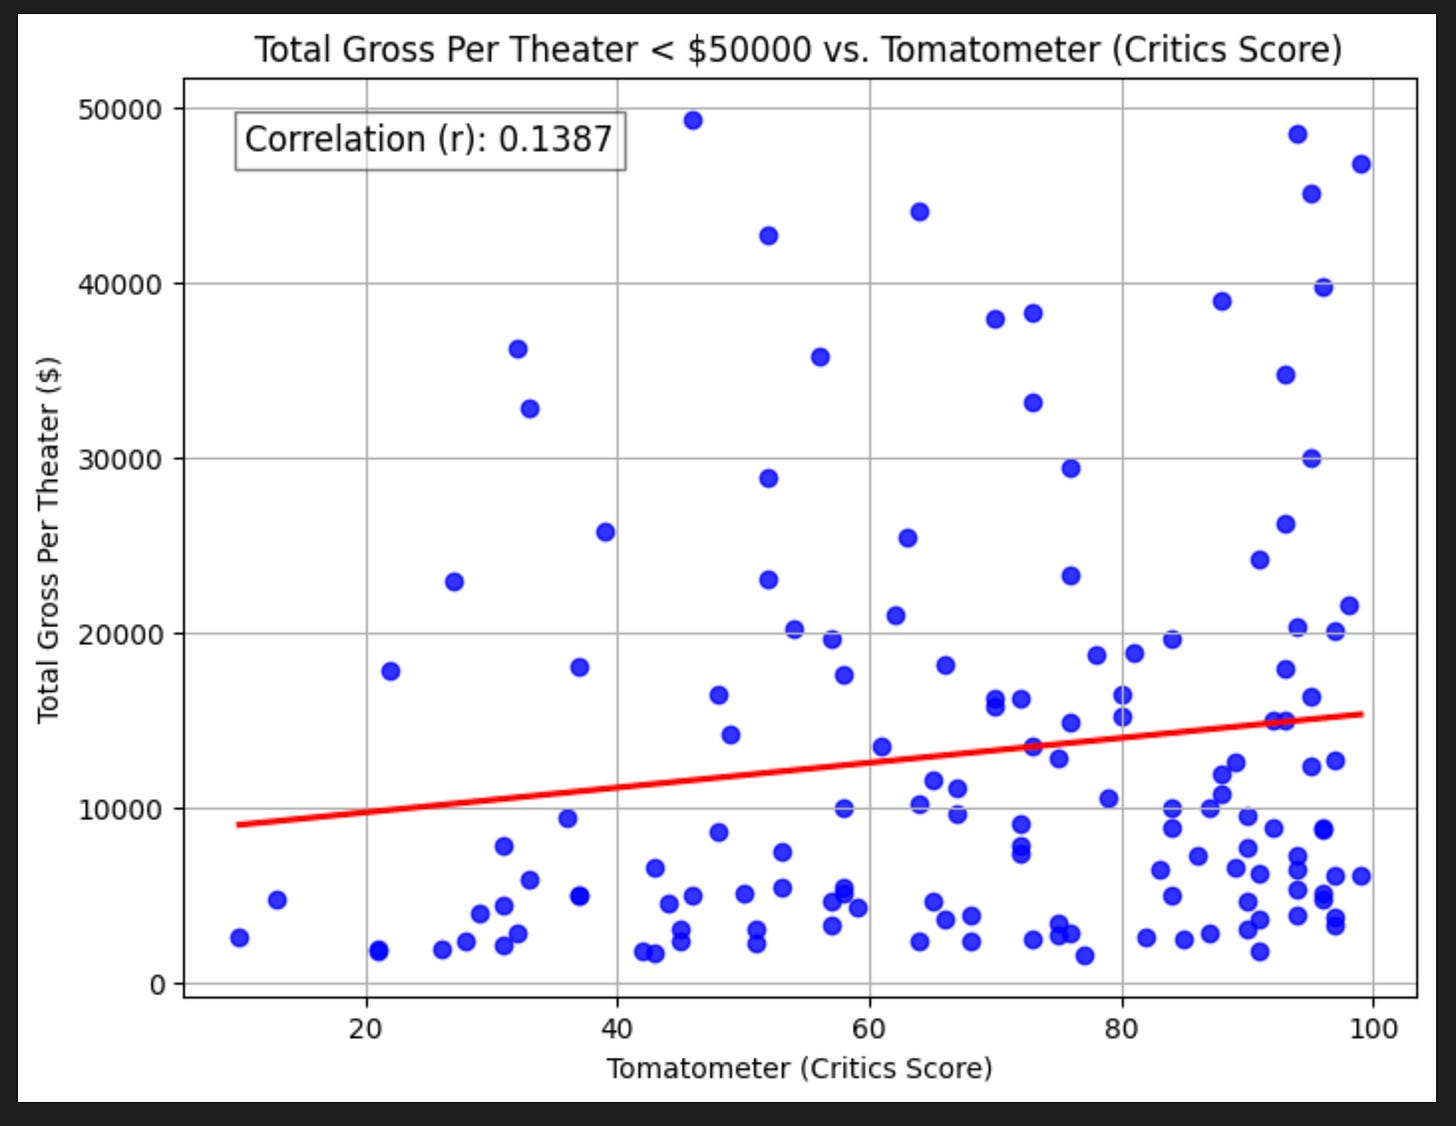
Critics Score
We’ve all seen the movie trailers that say things like “Critics are calling it a masterpiece”, “Stunning” — The New York Times. That’s great and all, but how much do these matter for the film’s grosses itself?
without removing outliers (films that grossed >$2billion), it seems critics’s opinions have a pretty weak relationship with grosses.
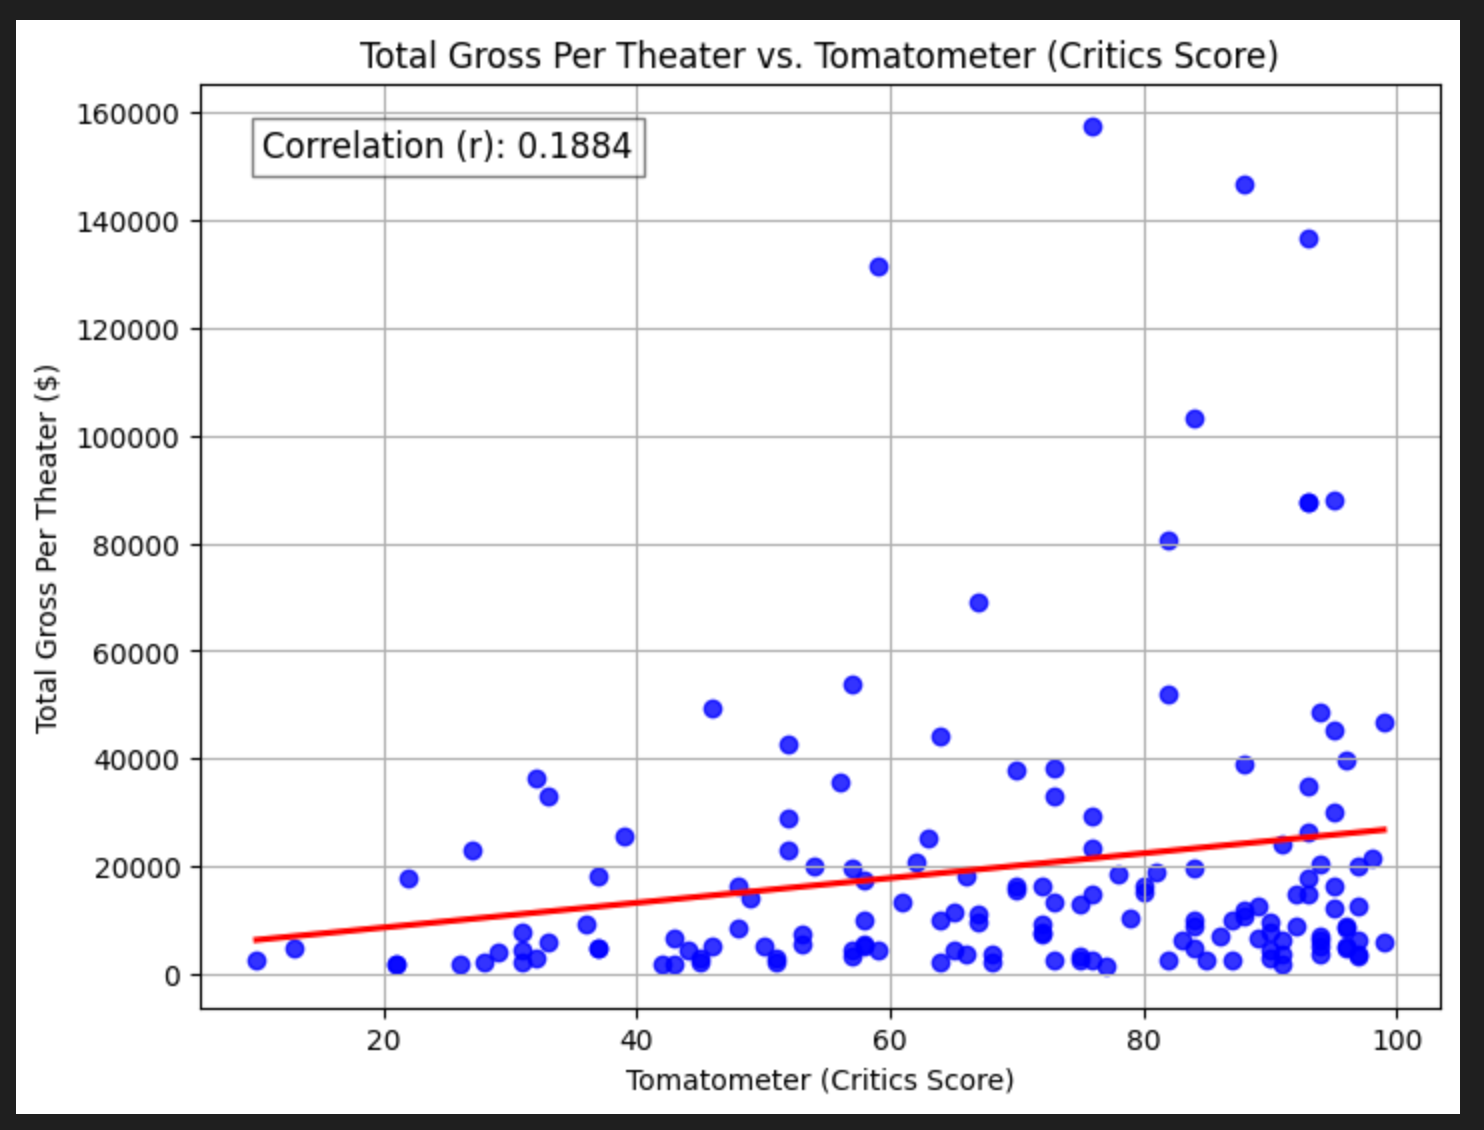
With removing those $2 billion+ films, the relationship is even worse!

So, it seems like critics may have more sophisticated opinions than the rest of us, but they don’t seem to matter much for the ultimate profitability of a movie.
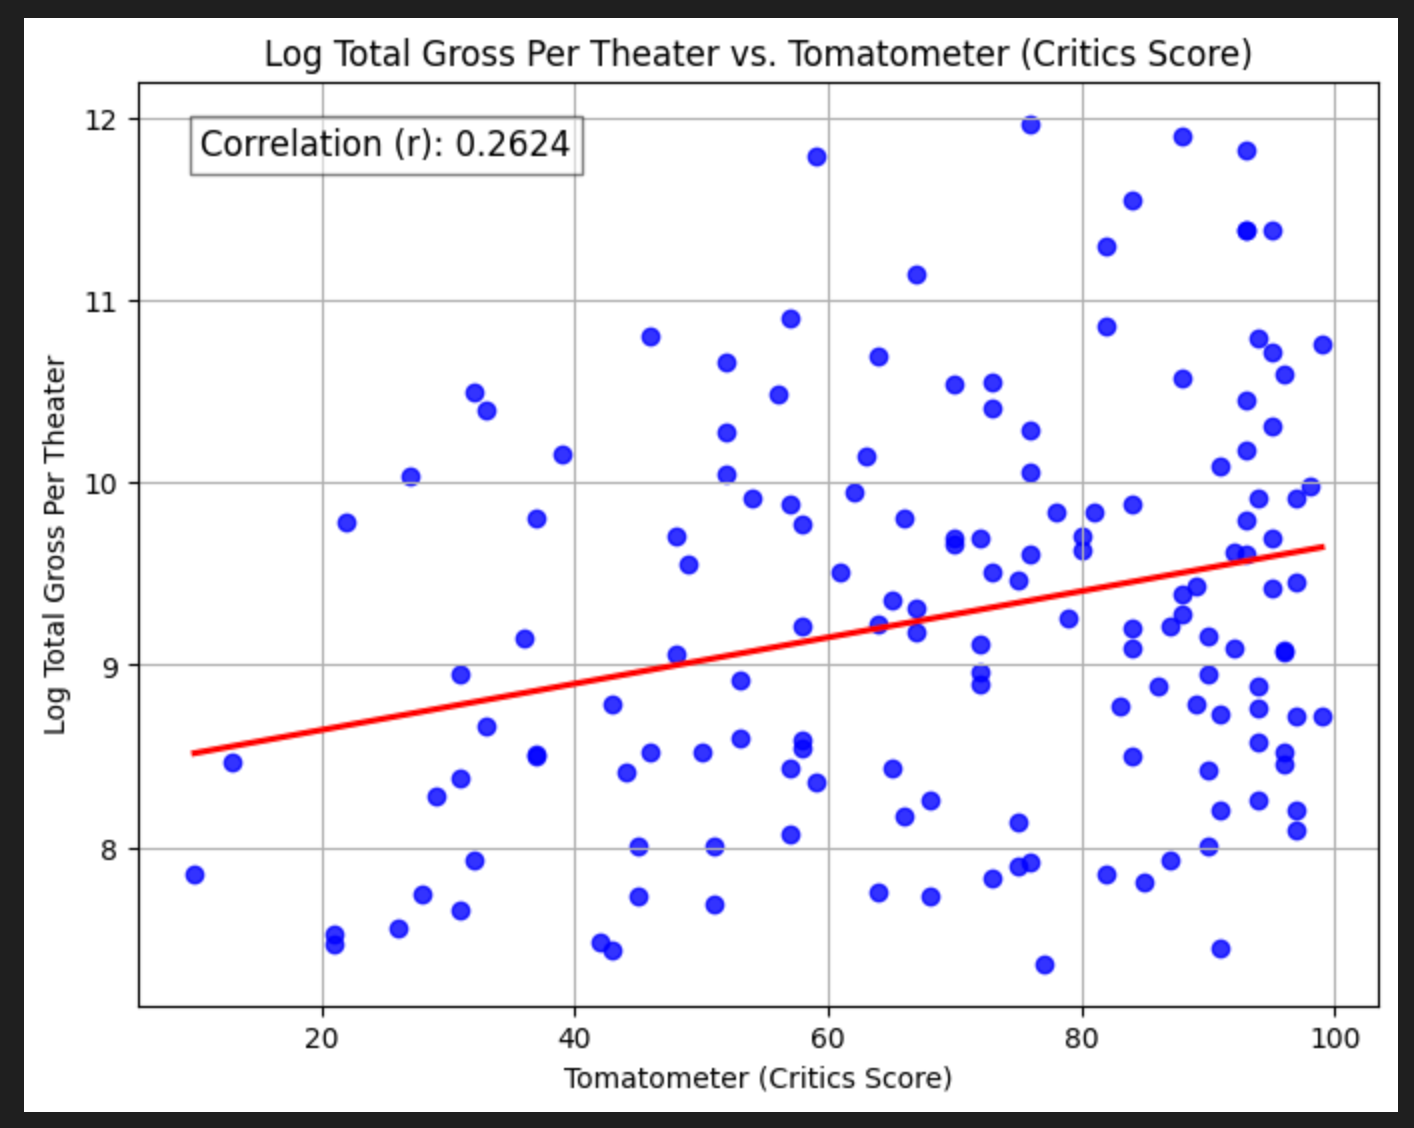
Log Total Gross Per Theater
You might notice in both the critics score and (particularly) the audience score regressions the spread of points around the line increases as review scores get higher. This means heteroskedasticity — non-uniform variance in errors. A quick trick for this is to take the log of the y value, so let’s do that.
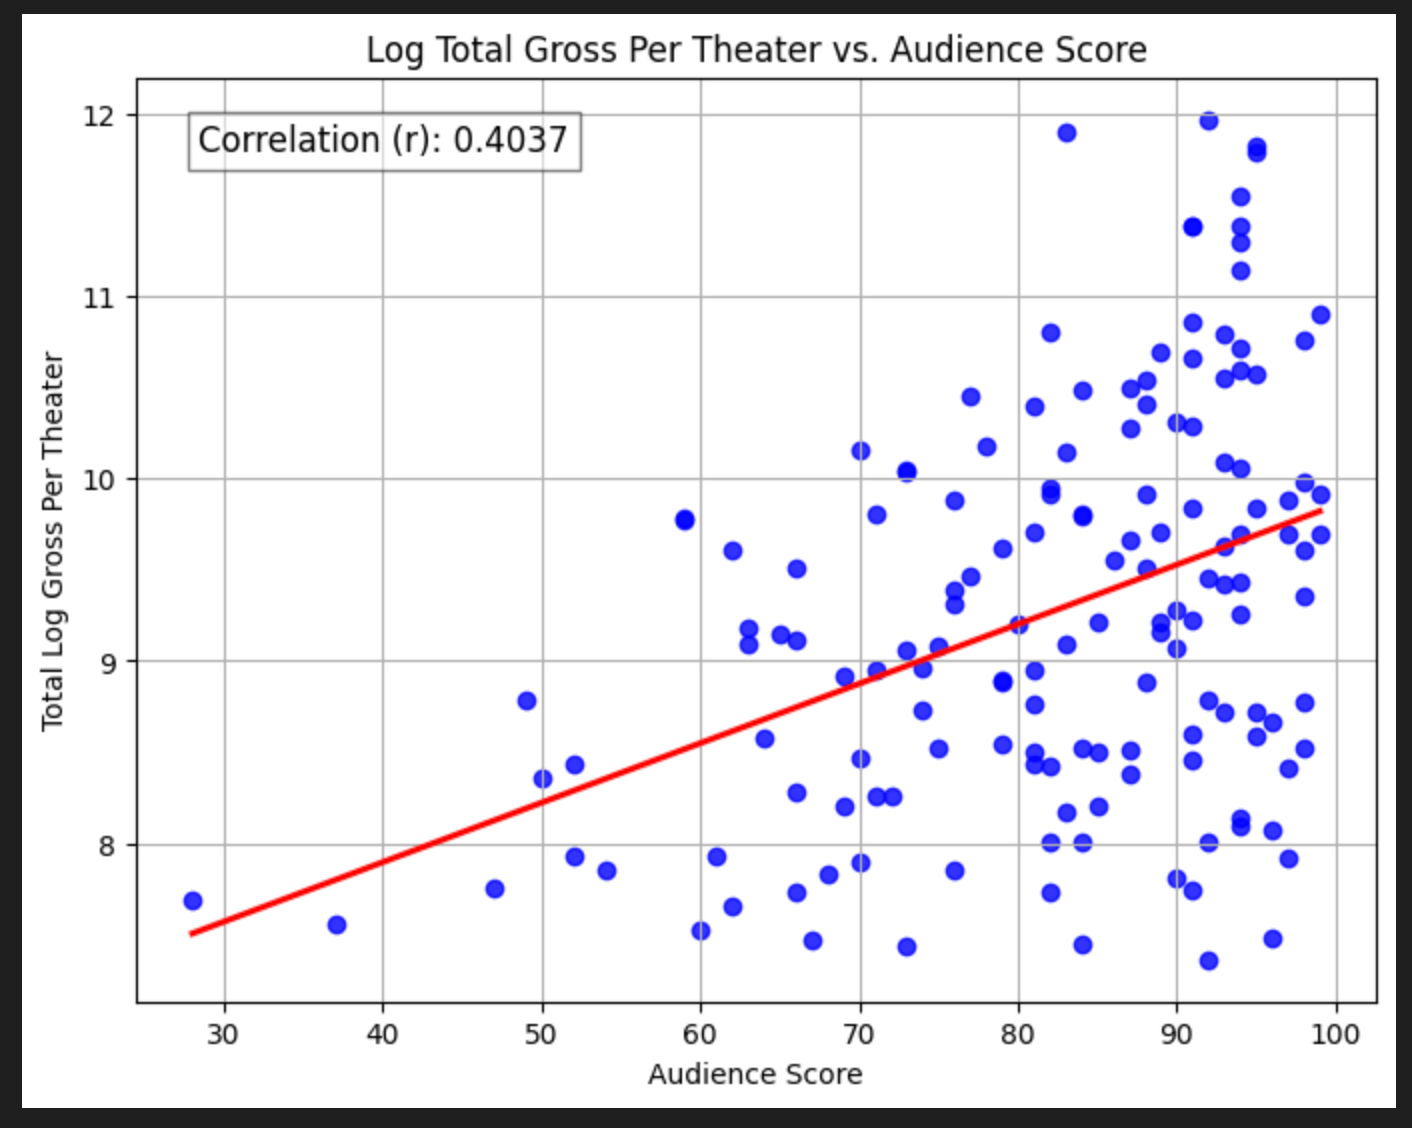
The correlations increase meaningfully for both! This is pretty interesting. Now we might say that the scores matter moderately.
Limitations & Caveats
No streaming numbers: This analysis doesn’t take into account is streaming. Many movies these days will do theatrical runs as well as release on streaming, and I have no way of capturing the streaming views or profitability over that medium. It’s possible there are plenty of movies grossed low in the box office because people just watched them at home.
Small sample: We’re just considering 152 movies (140 when dropping grosses above $2 billion) from 2023. It’s possible if we pulled 10 years of data, the conclusions might be different, or have changed over time — especially for movies that grossed less than $100 million. Perhaps 10 years ago people trusted critics more, but as more people get their information from social media rather than traditional media, critics’ predictive power on grosses has gone down.
No capture of marketing spend: I have no way of knowing how heavily a film was promoted, and I’m sure Barbie had tens of millions in marketing dollars behind it that Next Goal Wins did not. I suspect with this information, the regressions would be meaningfully better.
Time relationship of reviews with sales — You can imagine there’s some dynamic that goes like this: A movie comes out, people see it, some reviews come in, based on that maybe more people go see it, some more reviews come out, and if those reviews are good, more people go see it. So it’s conceivable that maybe there is some t → t+1, correlation between reviews and grosses. But in aggregate, it doesn’t seem to matter.
Uniform release in theaters: Based on the Box Office Mojo page for an individual movie, they may not release in all 2000 theaters at once. Consider the page for Priscilla paying attention to the “Theaters” column:
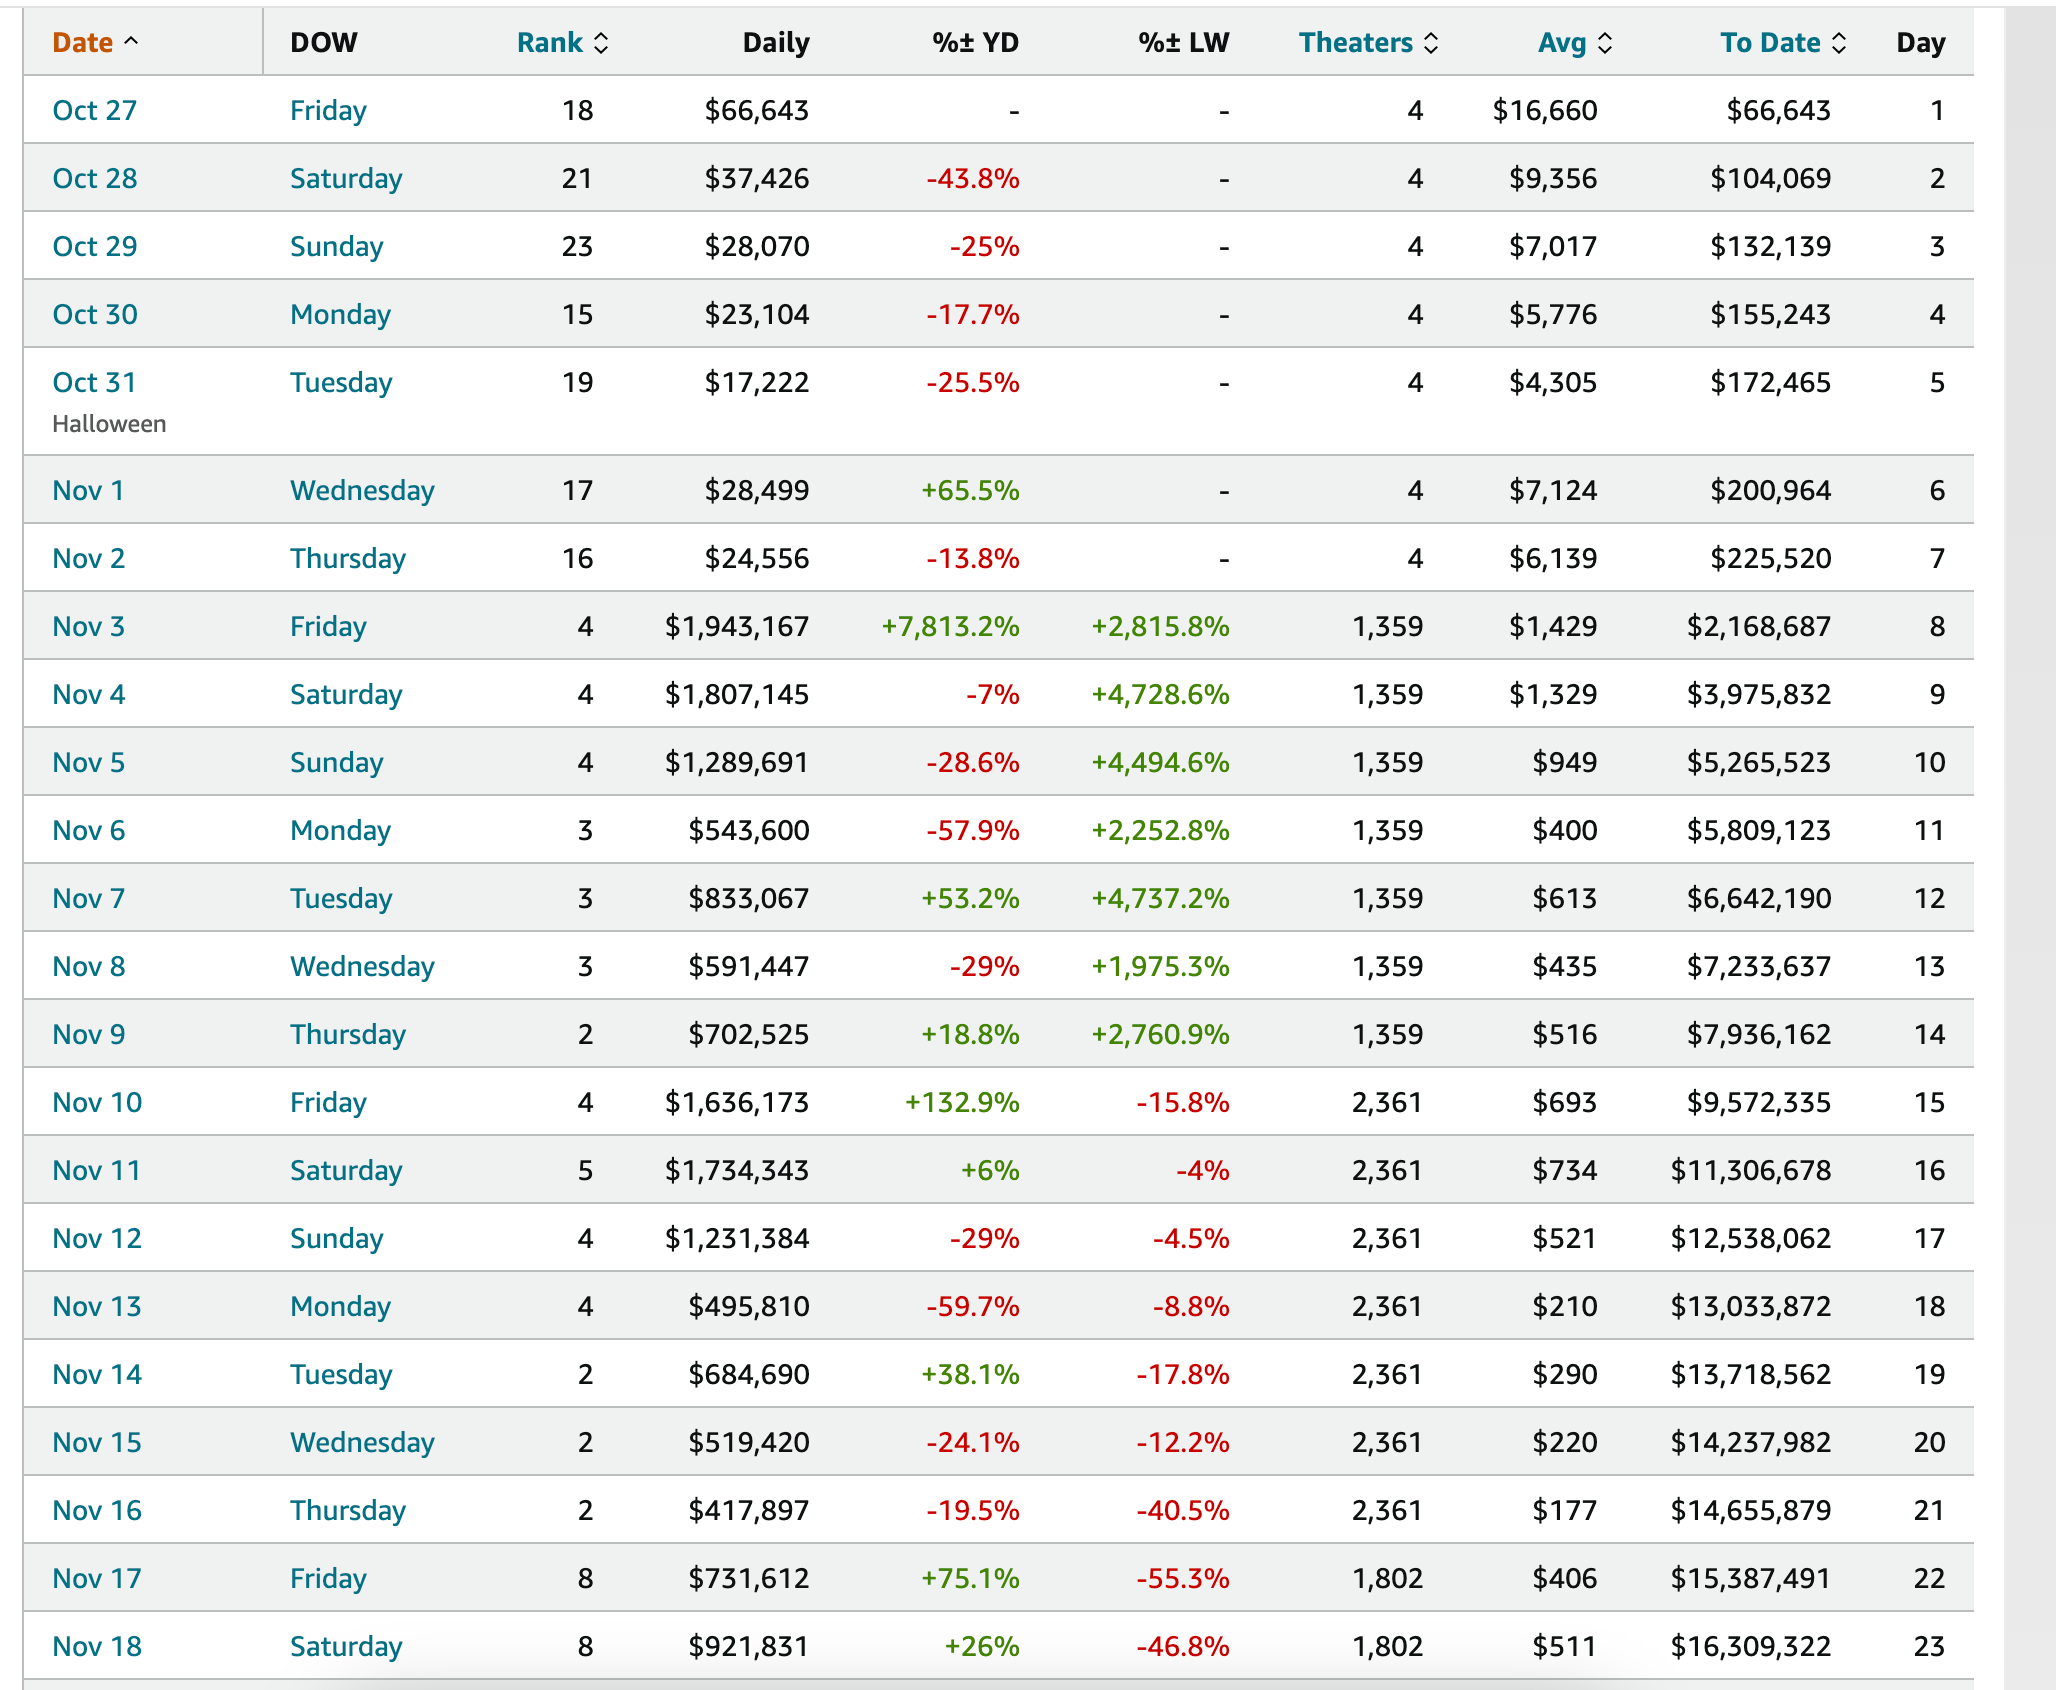
It starts out small, then, ramps up to 1300 theaters, then adds nearly 1000 more theaters, then drops 500 theaters, and the number of theaters continues to change as time goes on.
Given that I just used the max number of theaters a film played in reported on the main page scraping, it’s possible I was over-penalizing films if they were only at their max distribution for a few weeks of a year-month run. I suspect that the correlations would also improve if I were to pull the theater counts for each page like this.
Ticket price inflation: Within just one year I can’t imagine ticket prices changed that much, but 2023 was a banner year for general inflation. It’s possible this might skew our results some but my hunch is the effect is small. If we were to pull more years though, this could be a real factor.
Normalizing by number of days: different movies play in theaters for varying amounts of time. I could’ve gone a step further by pulling the number of days for each film. It would’ve added a lot of overhead to the scrape though, and I’m not sure how much the overall conclusion would change. That would be good for a V2 of this analysis.
Future Questions
There’s a lot of interesting things I would look at down the line.
Average grosses and reviews by subsets: Are there certain actors, combination of actors, directors, genres etc. who gross more or tend to be ranked more highly?
More grosses+reviews data: I only looked at one year, it’d be much more interesting to look across 10 or 20. I’m willing to bet the critic to grosses relationship was meaningfully stronger 10 years ago.
Streaming data: As mentioned I have no way to capture streaming numbers right now. For a long time none of the streamers disclosed viewing numbers for individual titles, but that seems to be changing. For example, Netflix now releases a report twice annually with viewing hours for 180,000 titles globally. Adding this data in would be interesting
Deeper addressing of heteroskedasticity: We quickly looked at taking the log of gross per theater and it meaningfully improved correlations. With more time I’d further dig into ways to further address heteroskedasticity, its interpretation, and implications.